Note
Click here to download the full example code
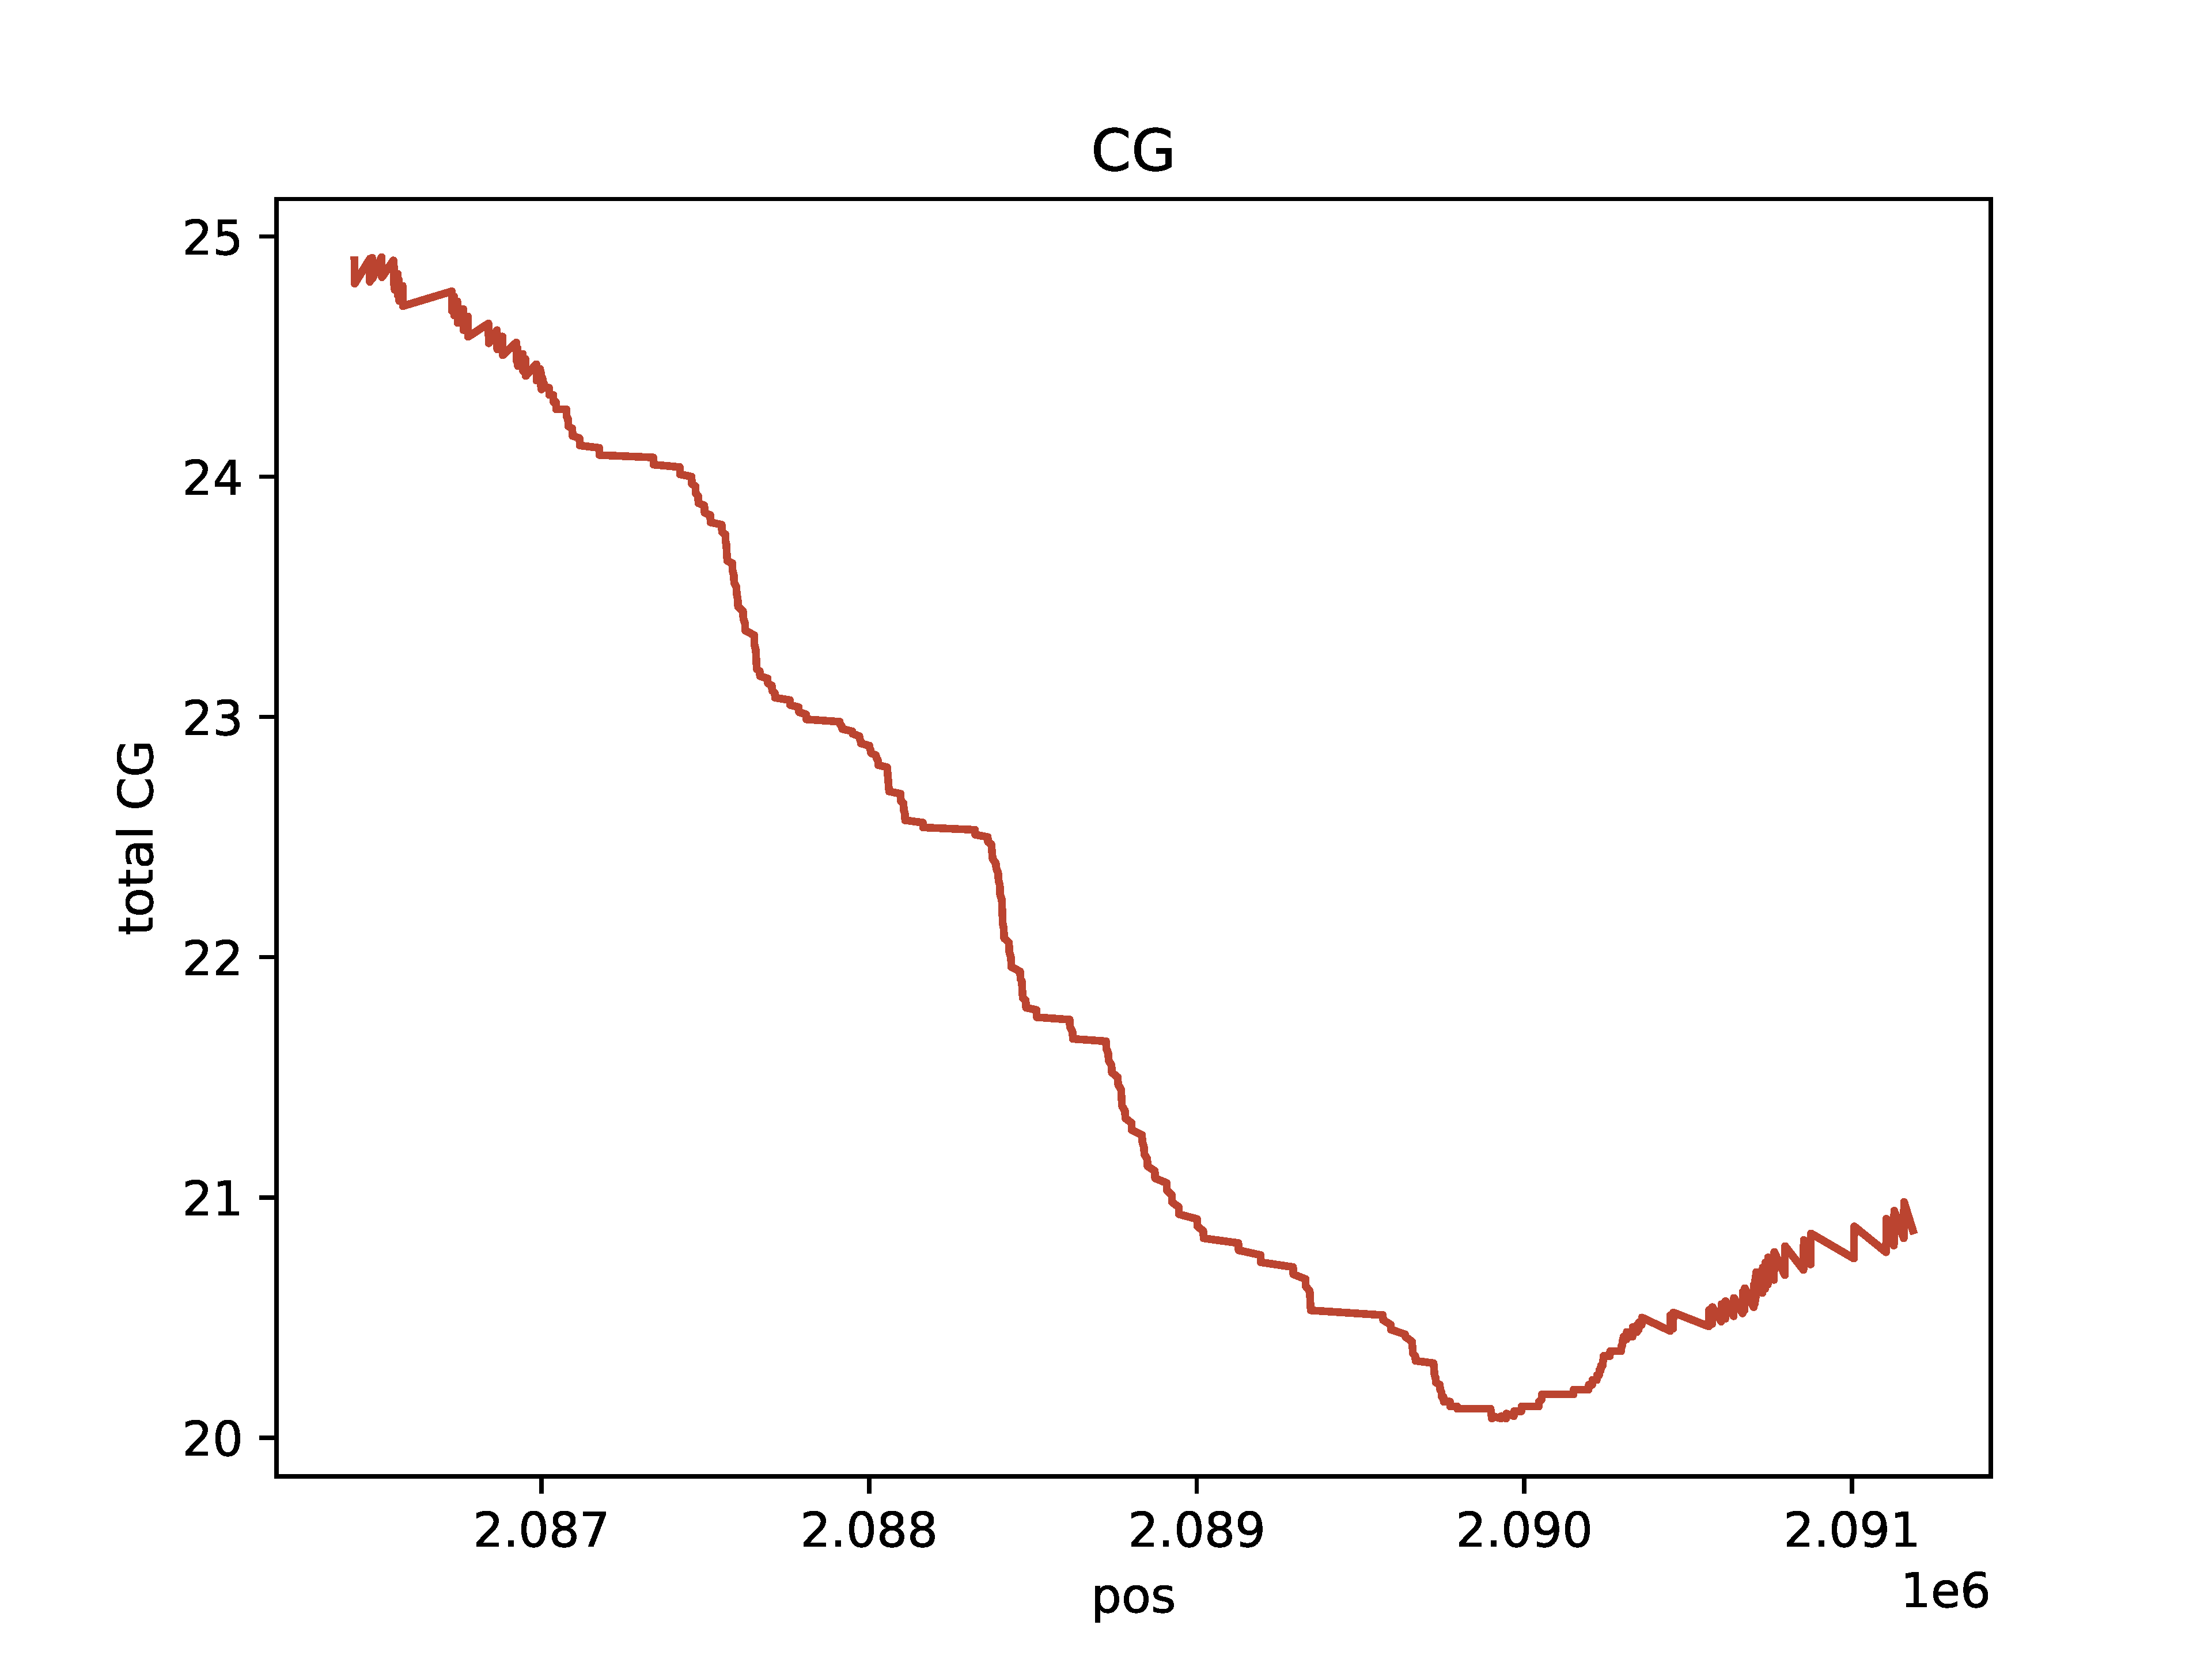
Single-Molecule Browser Plot
Plot single molecules with colored base modifications in a region of interest
Create either an interactive single-molecule HTML browser if static=False, or create a PDF if static=True. Base modifications are colored by type (mA vs. mCG) and probability of modification. Example data for producing these plots can be downloaded from SRA: https://www.ncbi.nlm.nih.gov/bioproject/752170 The below Python and command line options produce the same output.
1. Python option
import dimelo as dm

bam = "deep_ctcf_mod_mappings_merge.sorted.bam"
sampleName = "CTCF"
outDir = "./out"
dm.plot_browser(
    bam,
    sampleName,
    "chr11:2086423-2091187",
    "A+CG",
    outDir,
    threshA=153,
    threshC=153,
    static=True,
    smooth=100,
    min_periods=10,
)
2. Command line option
dimelo-plot-browser -f deep_ctcf_mod_mappings_merge.sorted.bam -s CTCF -r chr11:2086423-2091187 -m A+CG -o ./out -A 153 -C 153 --static -t 100 -n 10
Output
Total running time of the script: ( 0 minutes 0.000 seconds)