Note
Click here to download the full example code
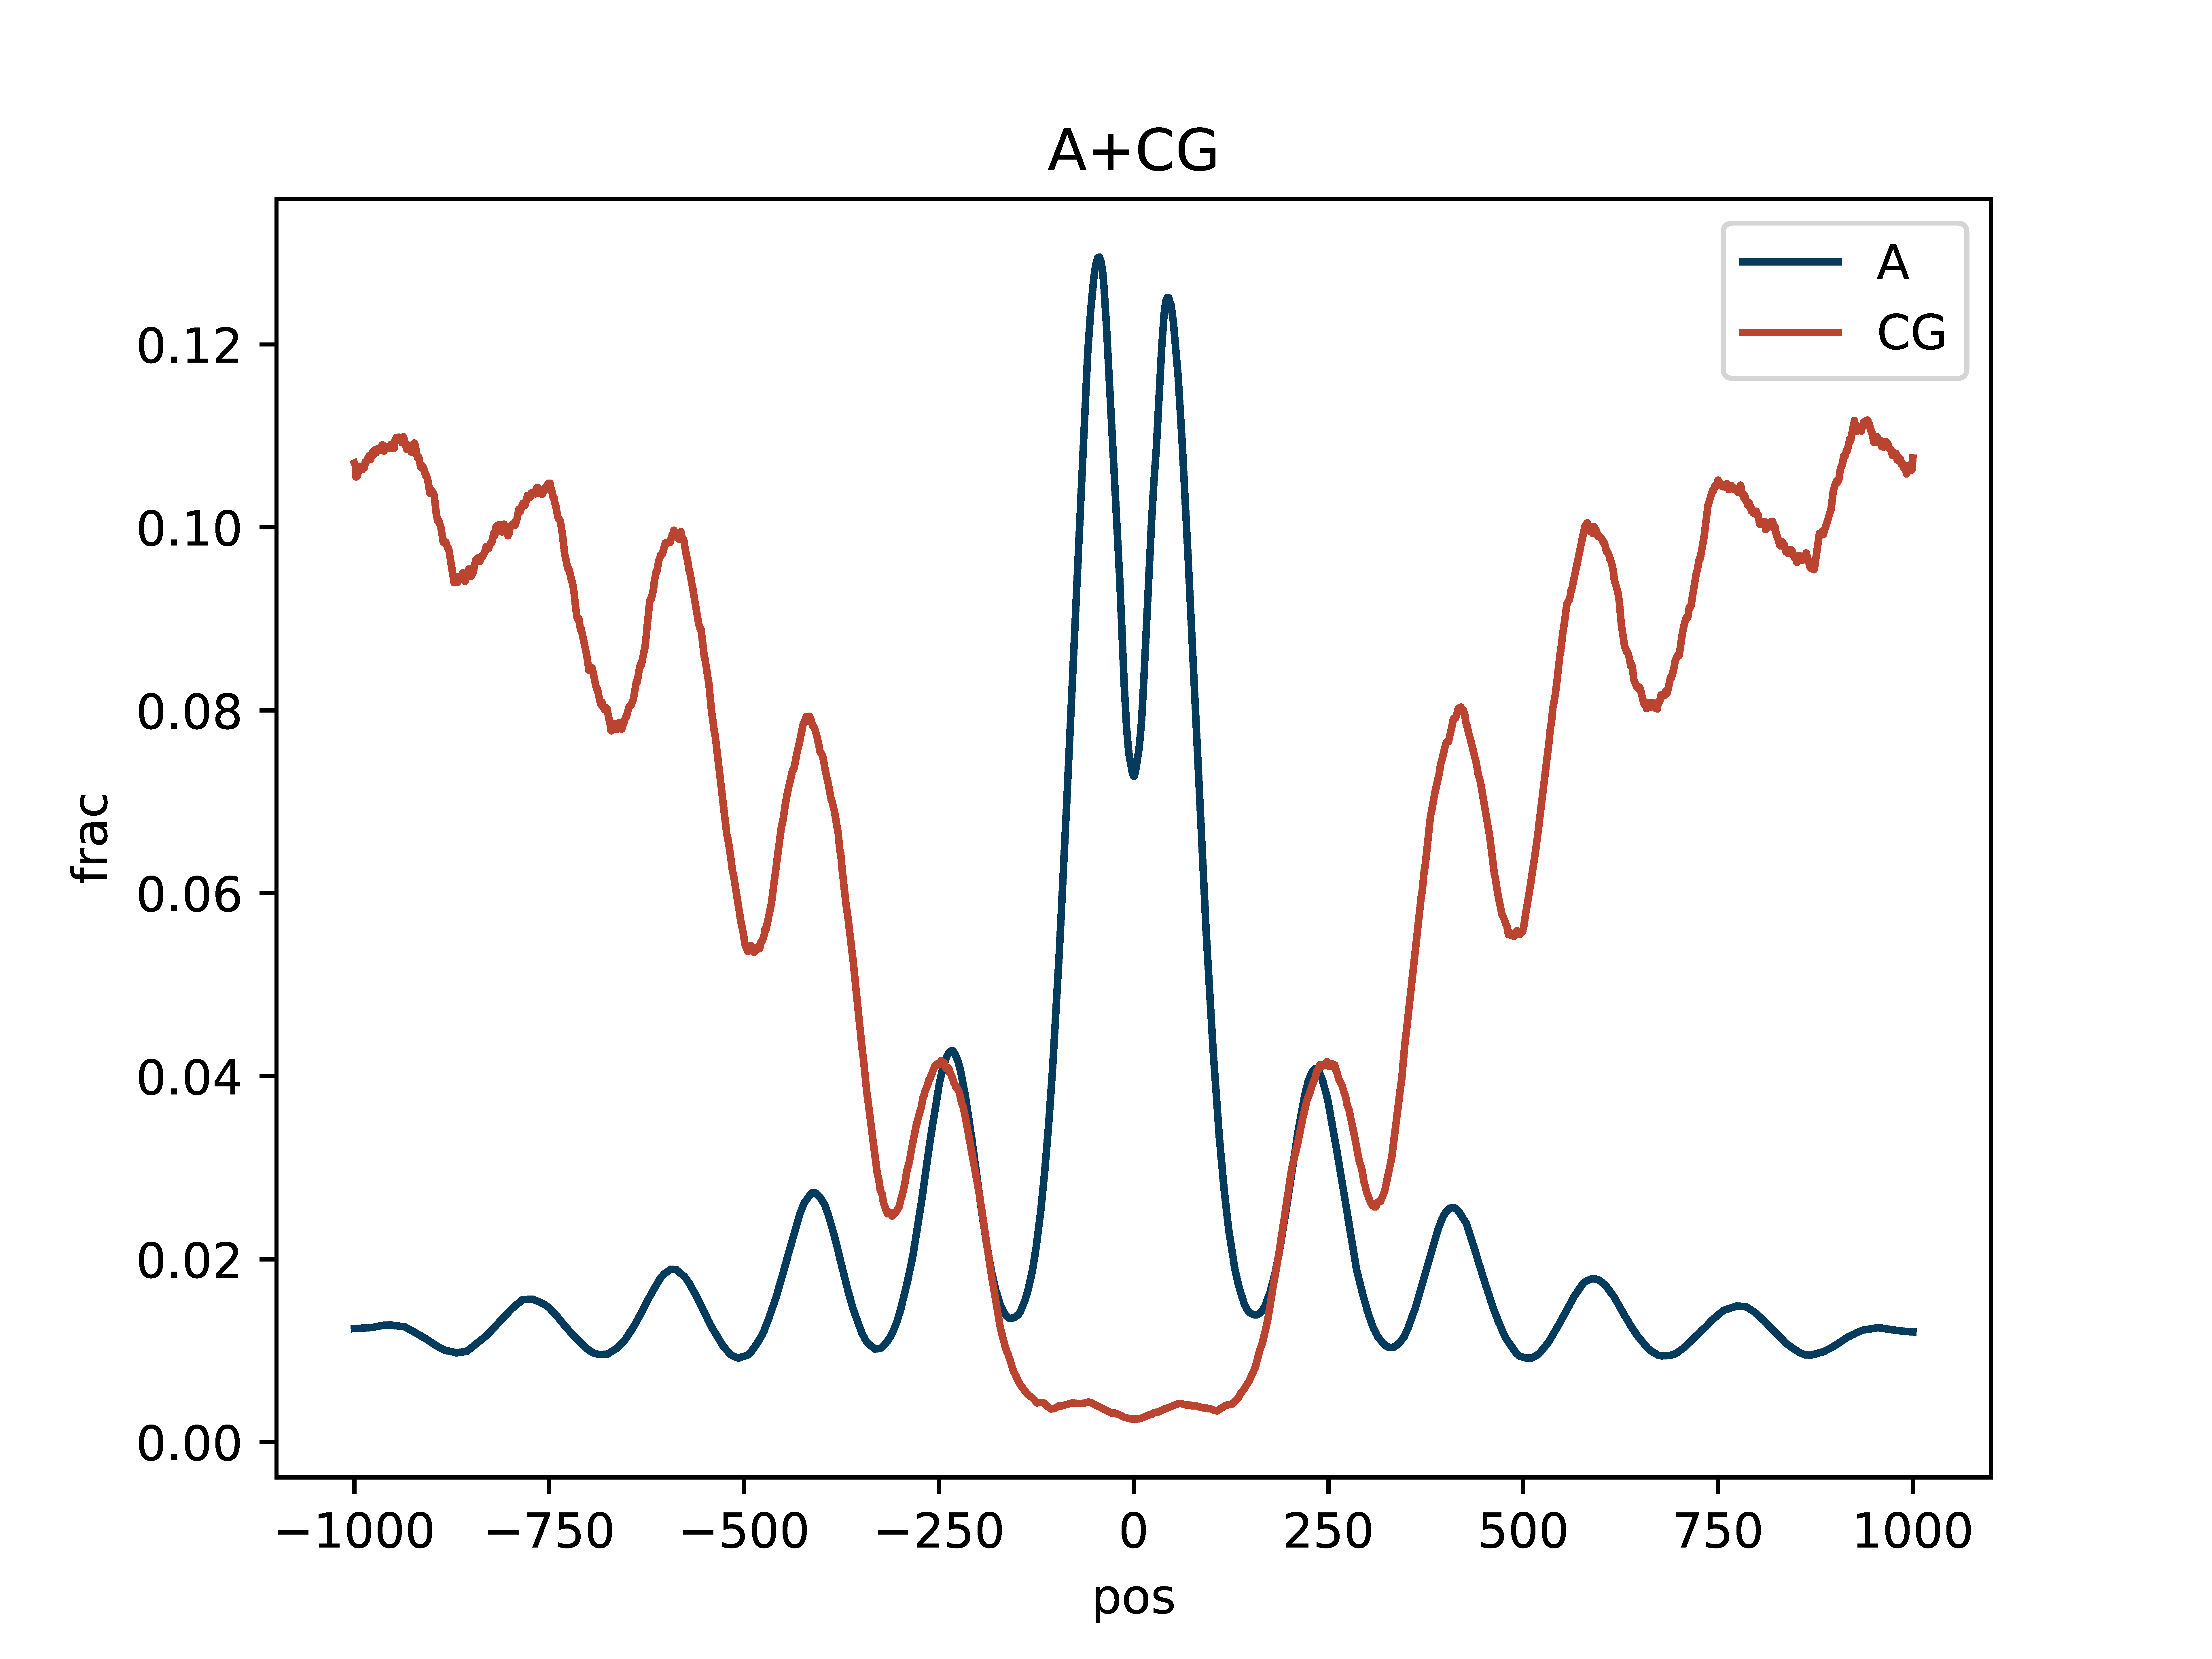
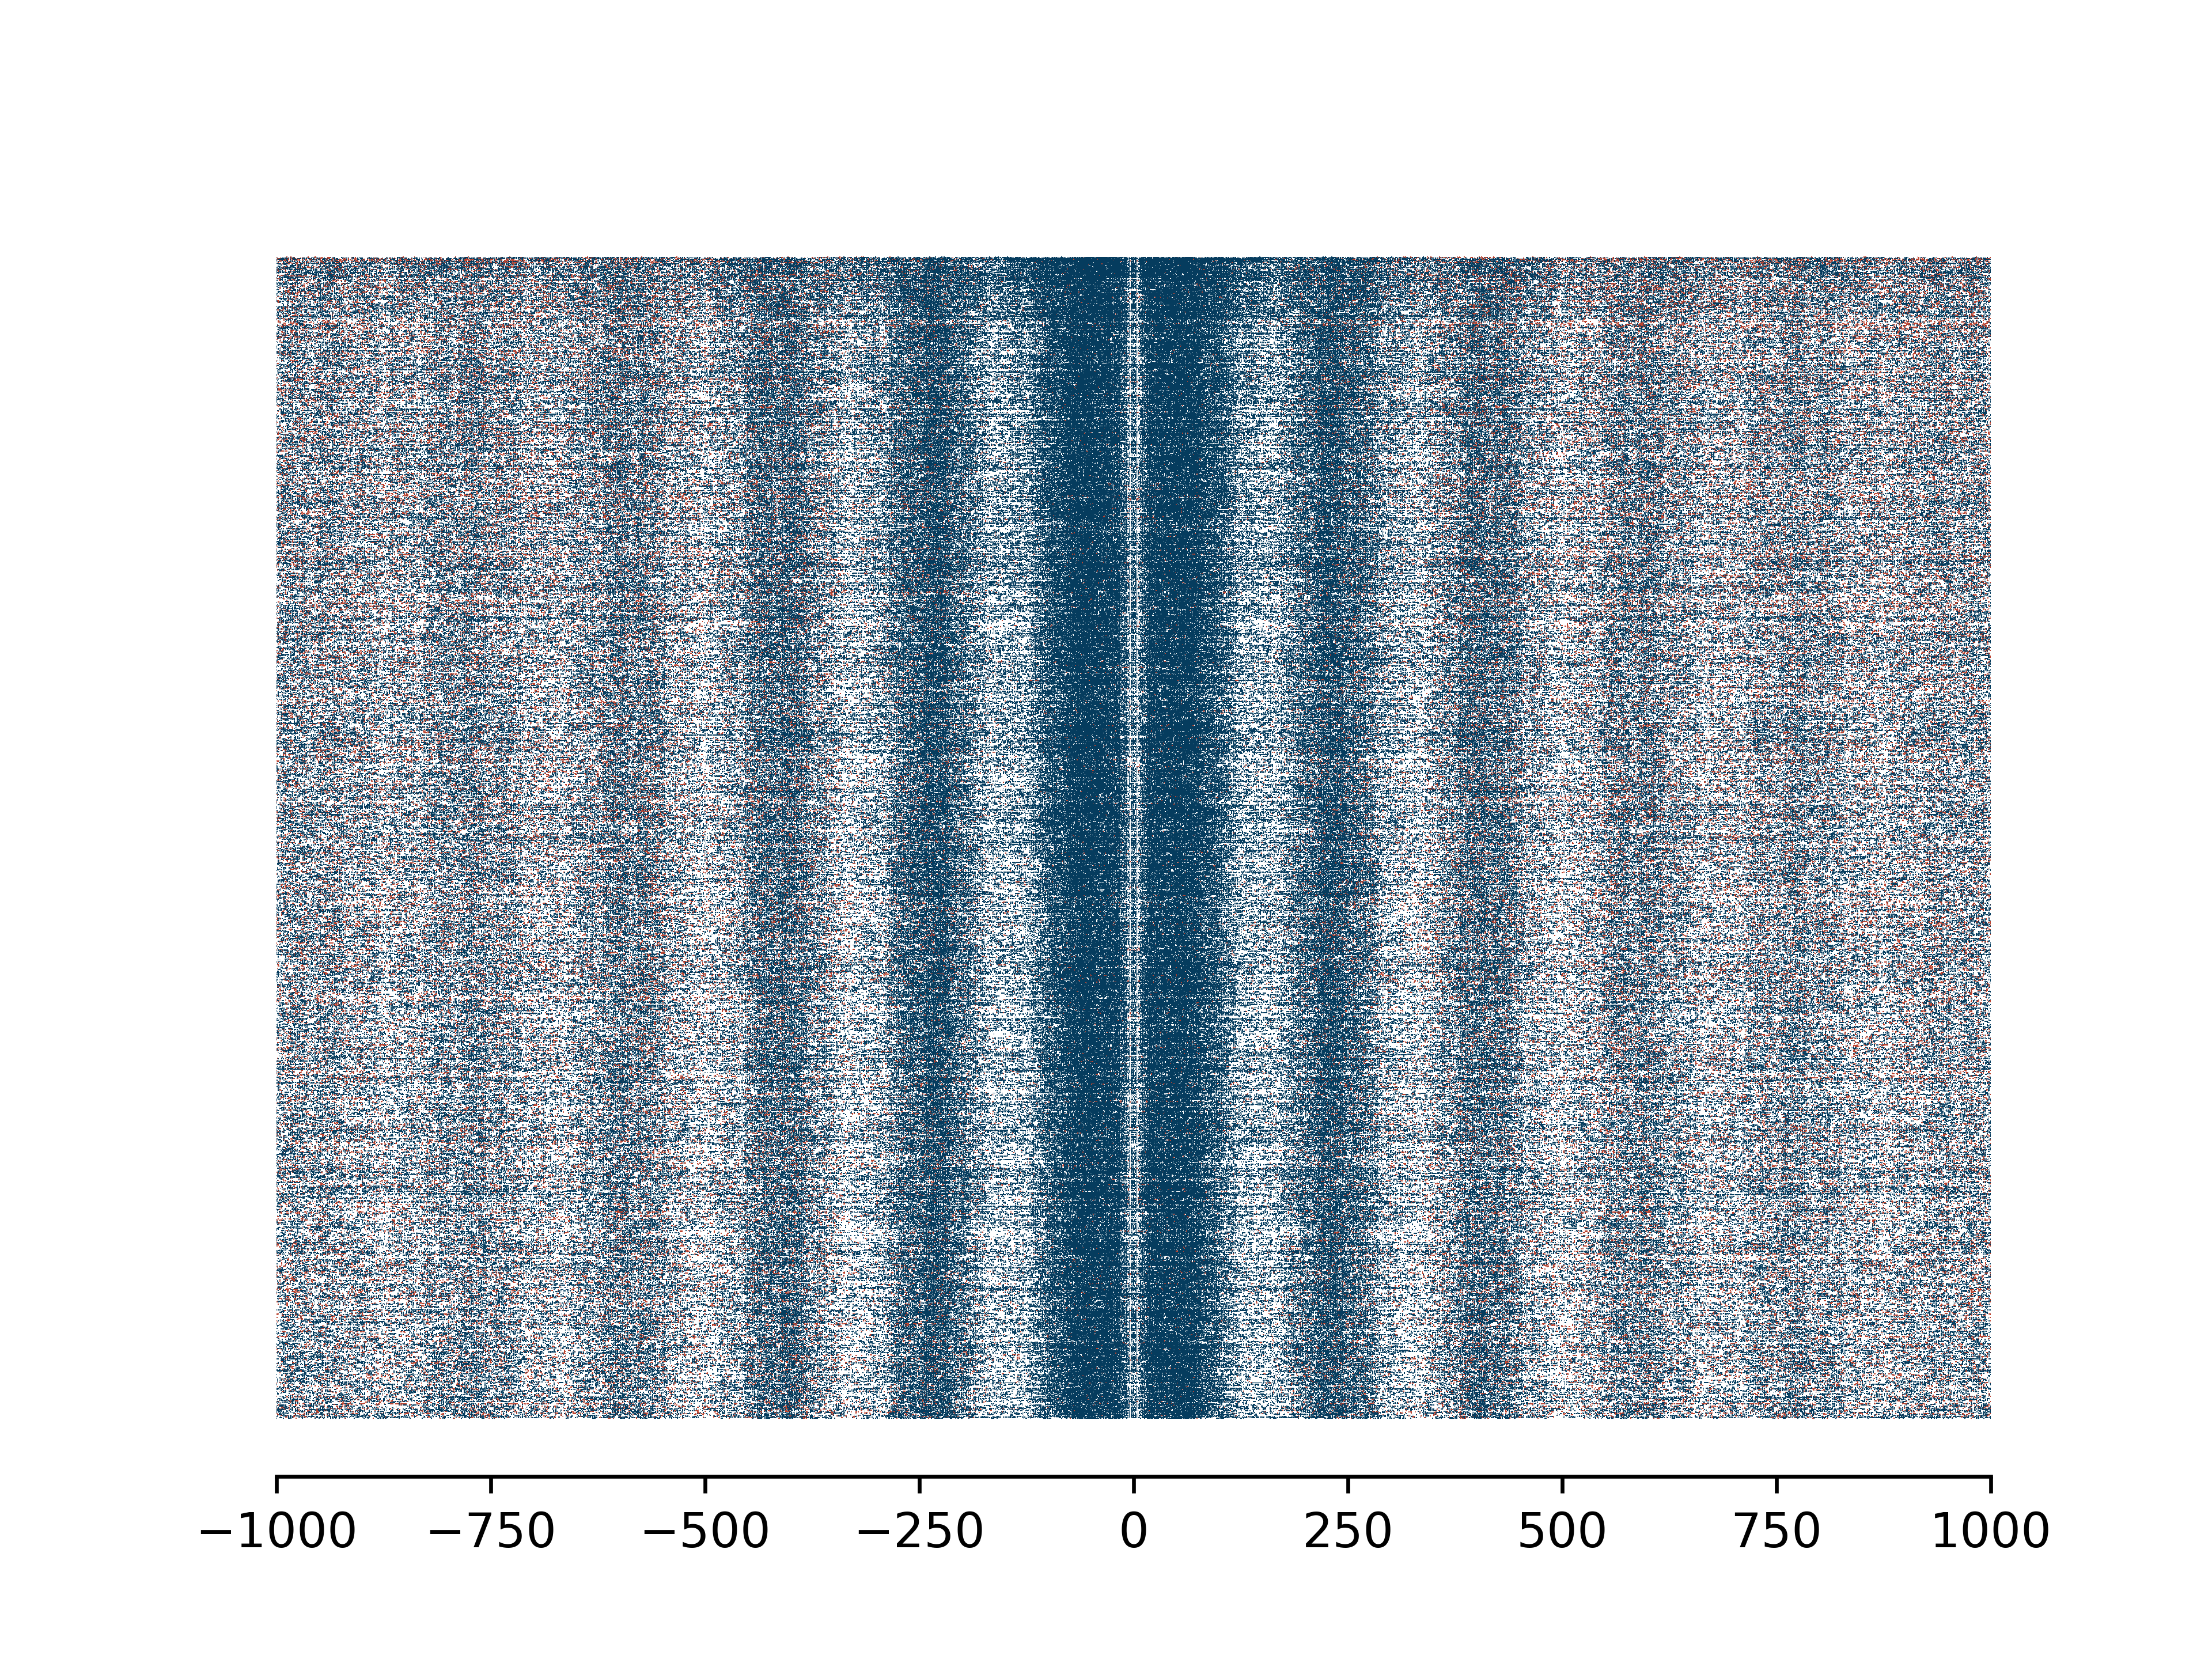
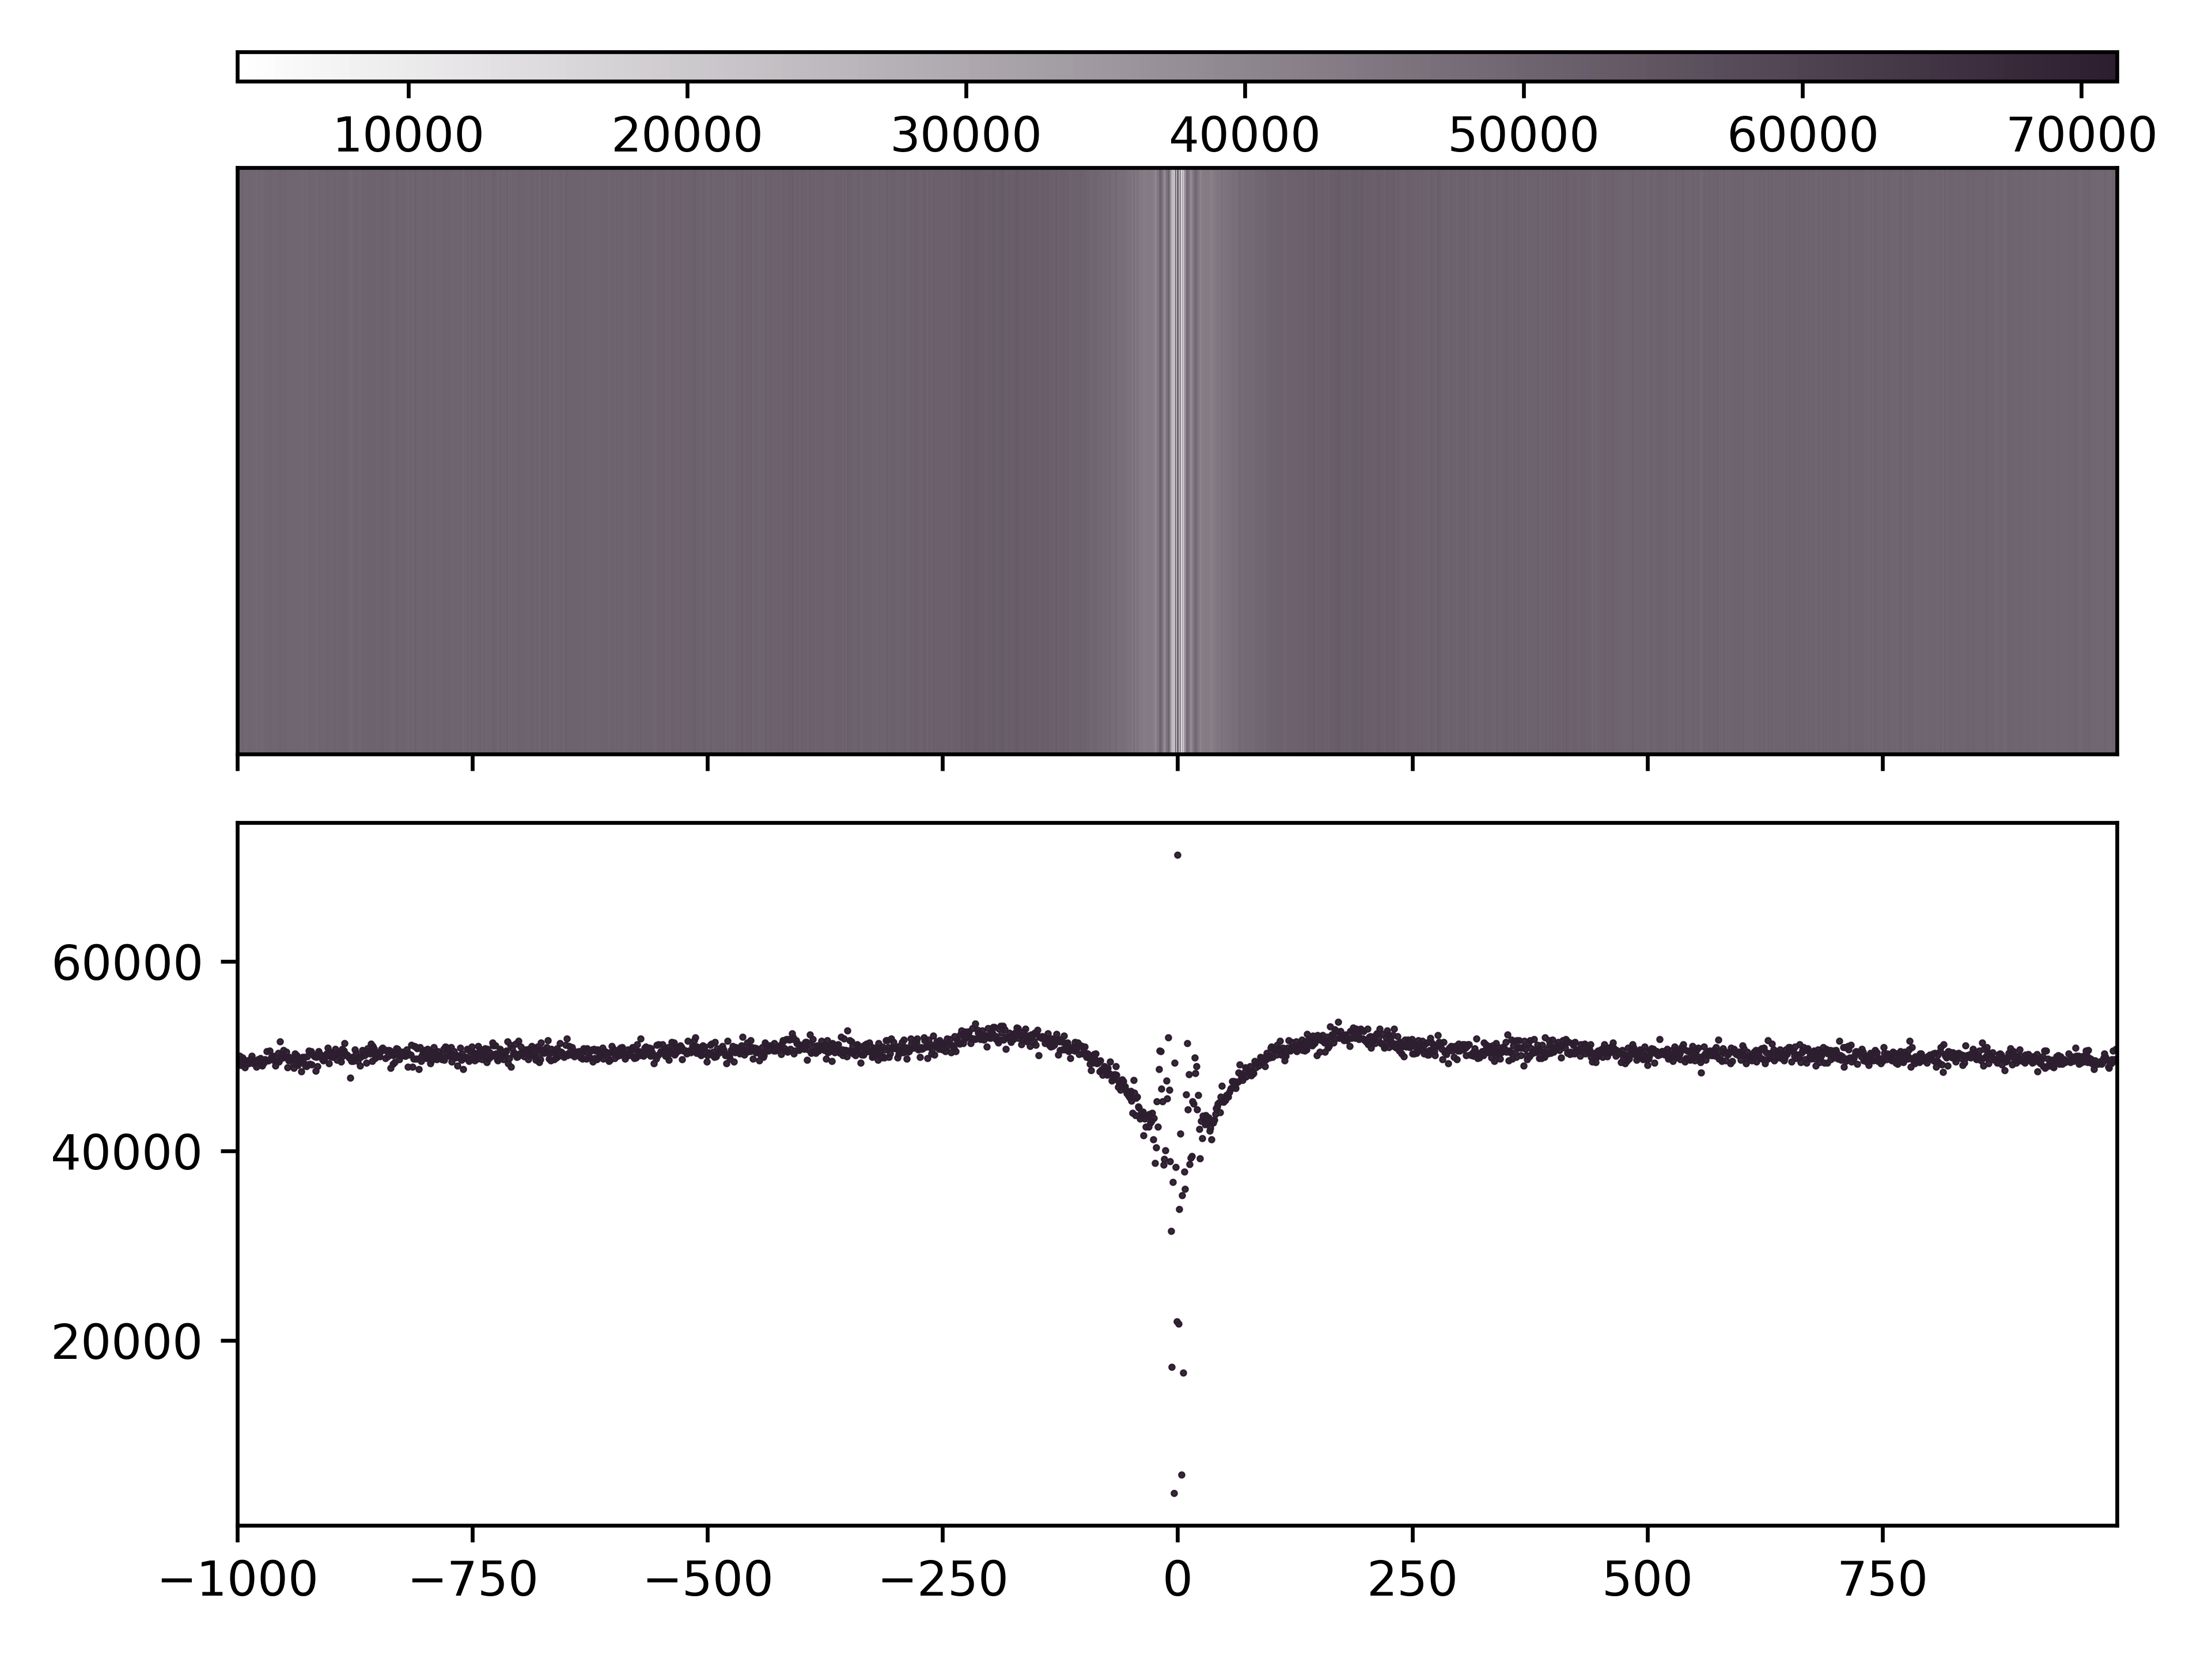
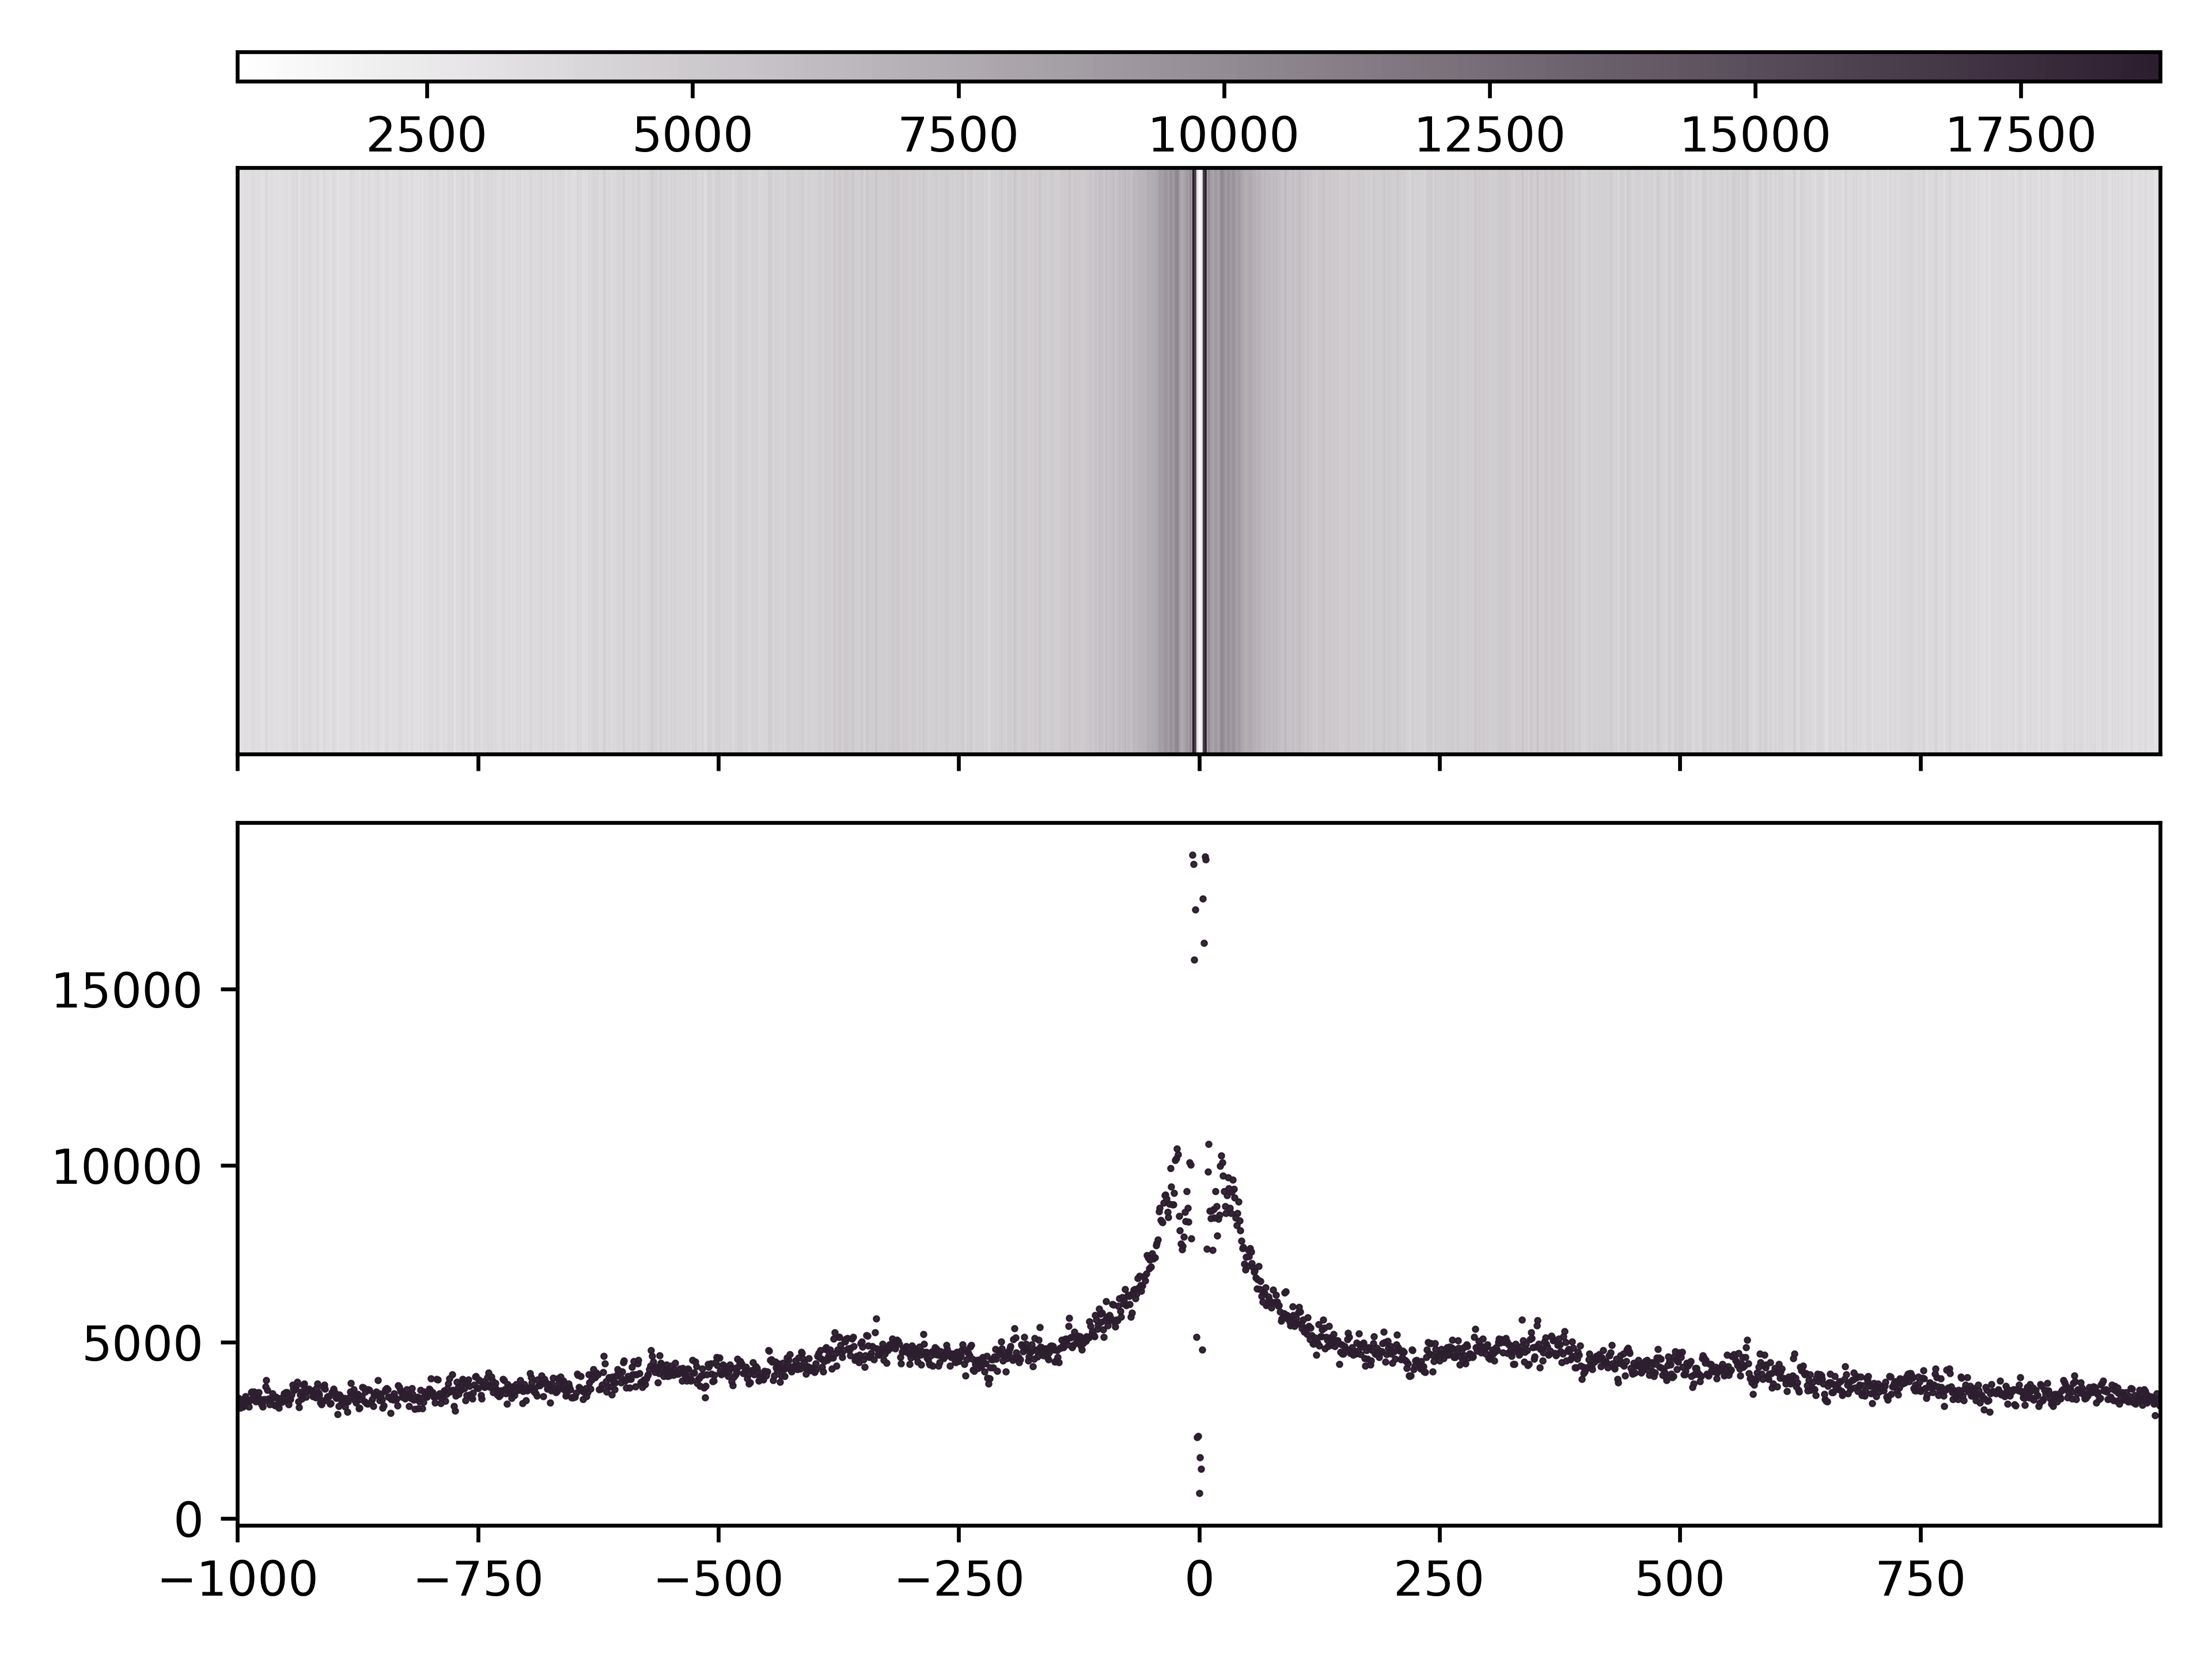
Enrichment Profile mA & mCG
Aggregate and single molecule plots colored by modification and centered at regions of interest defined in bed file.
Create (1) aggregate profile plots for mA/A and mCG/CG, (2) single-molecule plots for mA + mCG, and (3) base abundance plots for A and CG.
1. Python option
import dimelo as dm

bam = "deep_ctcf_mod_mappings_merge.sorted.bam"
sampleName = "quartile4"
bed = "quart4.bed"
outDir = "./out"
dm.plot_enrichment_profile(
    bam,
    sampleName,
    bed,
    "A+CG",
    outDir,
    threshA=190,
    threshC=190,
    dotsize=0.05,
)
2. Command line option
dimelo-plot-enrichment-profile -f deep_ctcf_mod_mappings_merge.sorted.bam -s quartile4 -b quart4.bed -m A+CG -o ./out -A 190 -C 190 -d 0.05
Output
Total running time of the script: ( 0 minutes 0.000 seconds)