Note
Click here to download the full example code
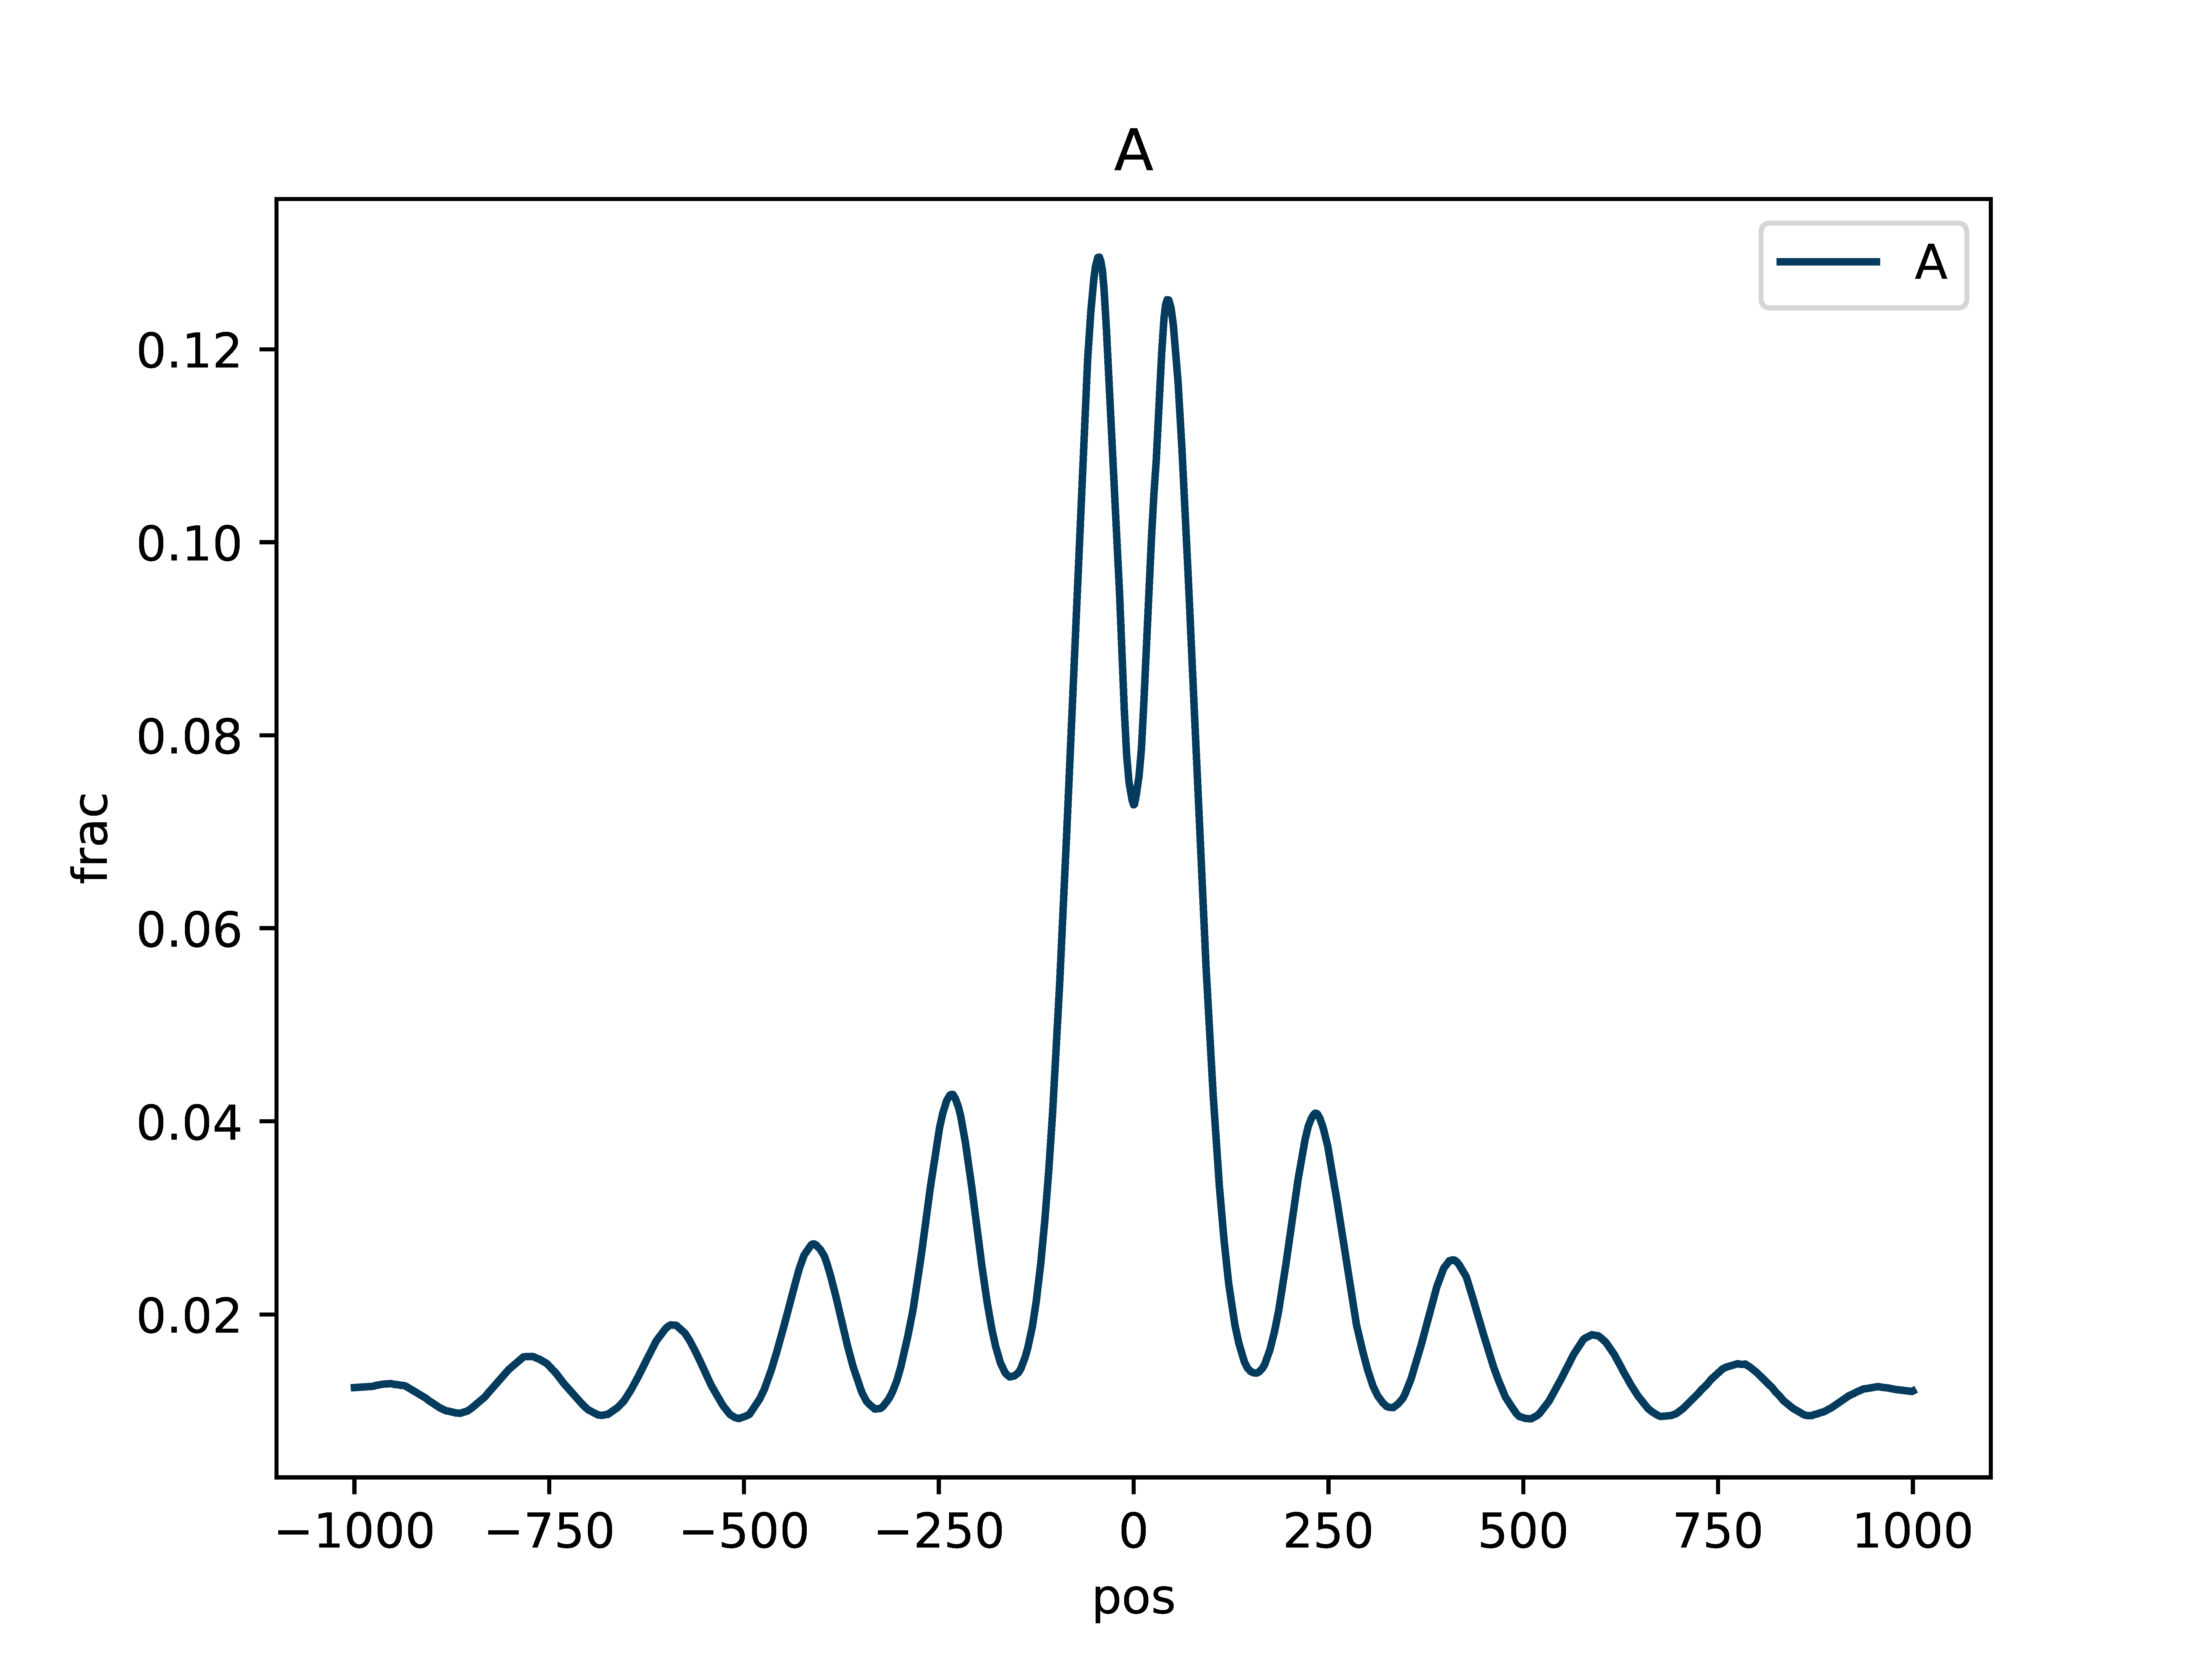
Enrichment Profile mA only
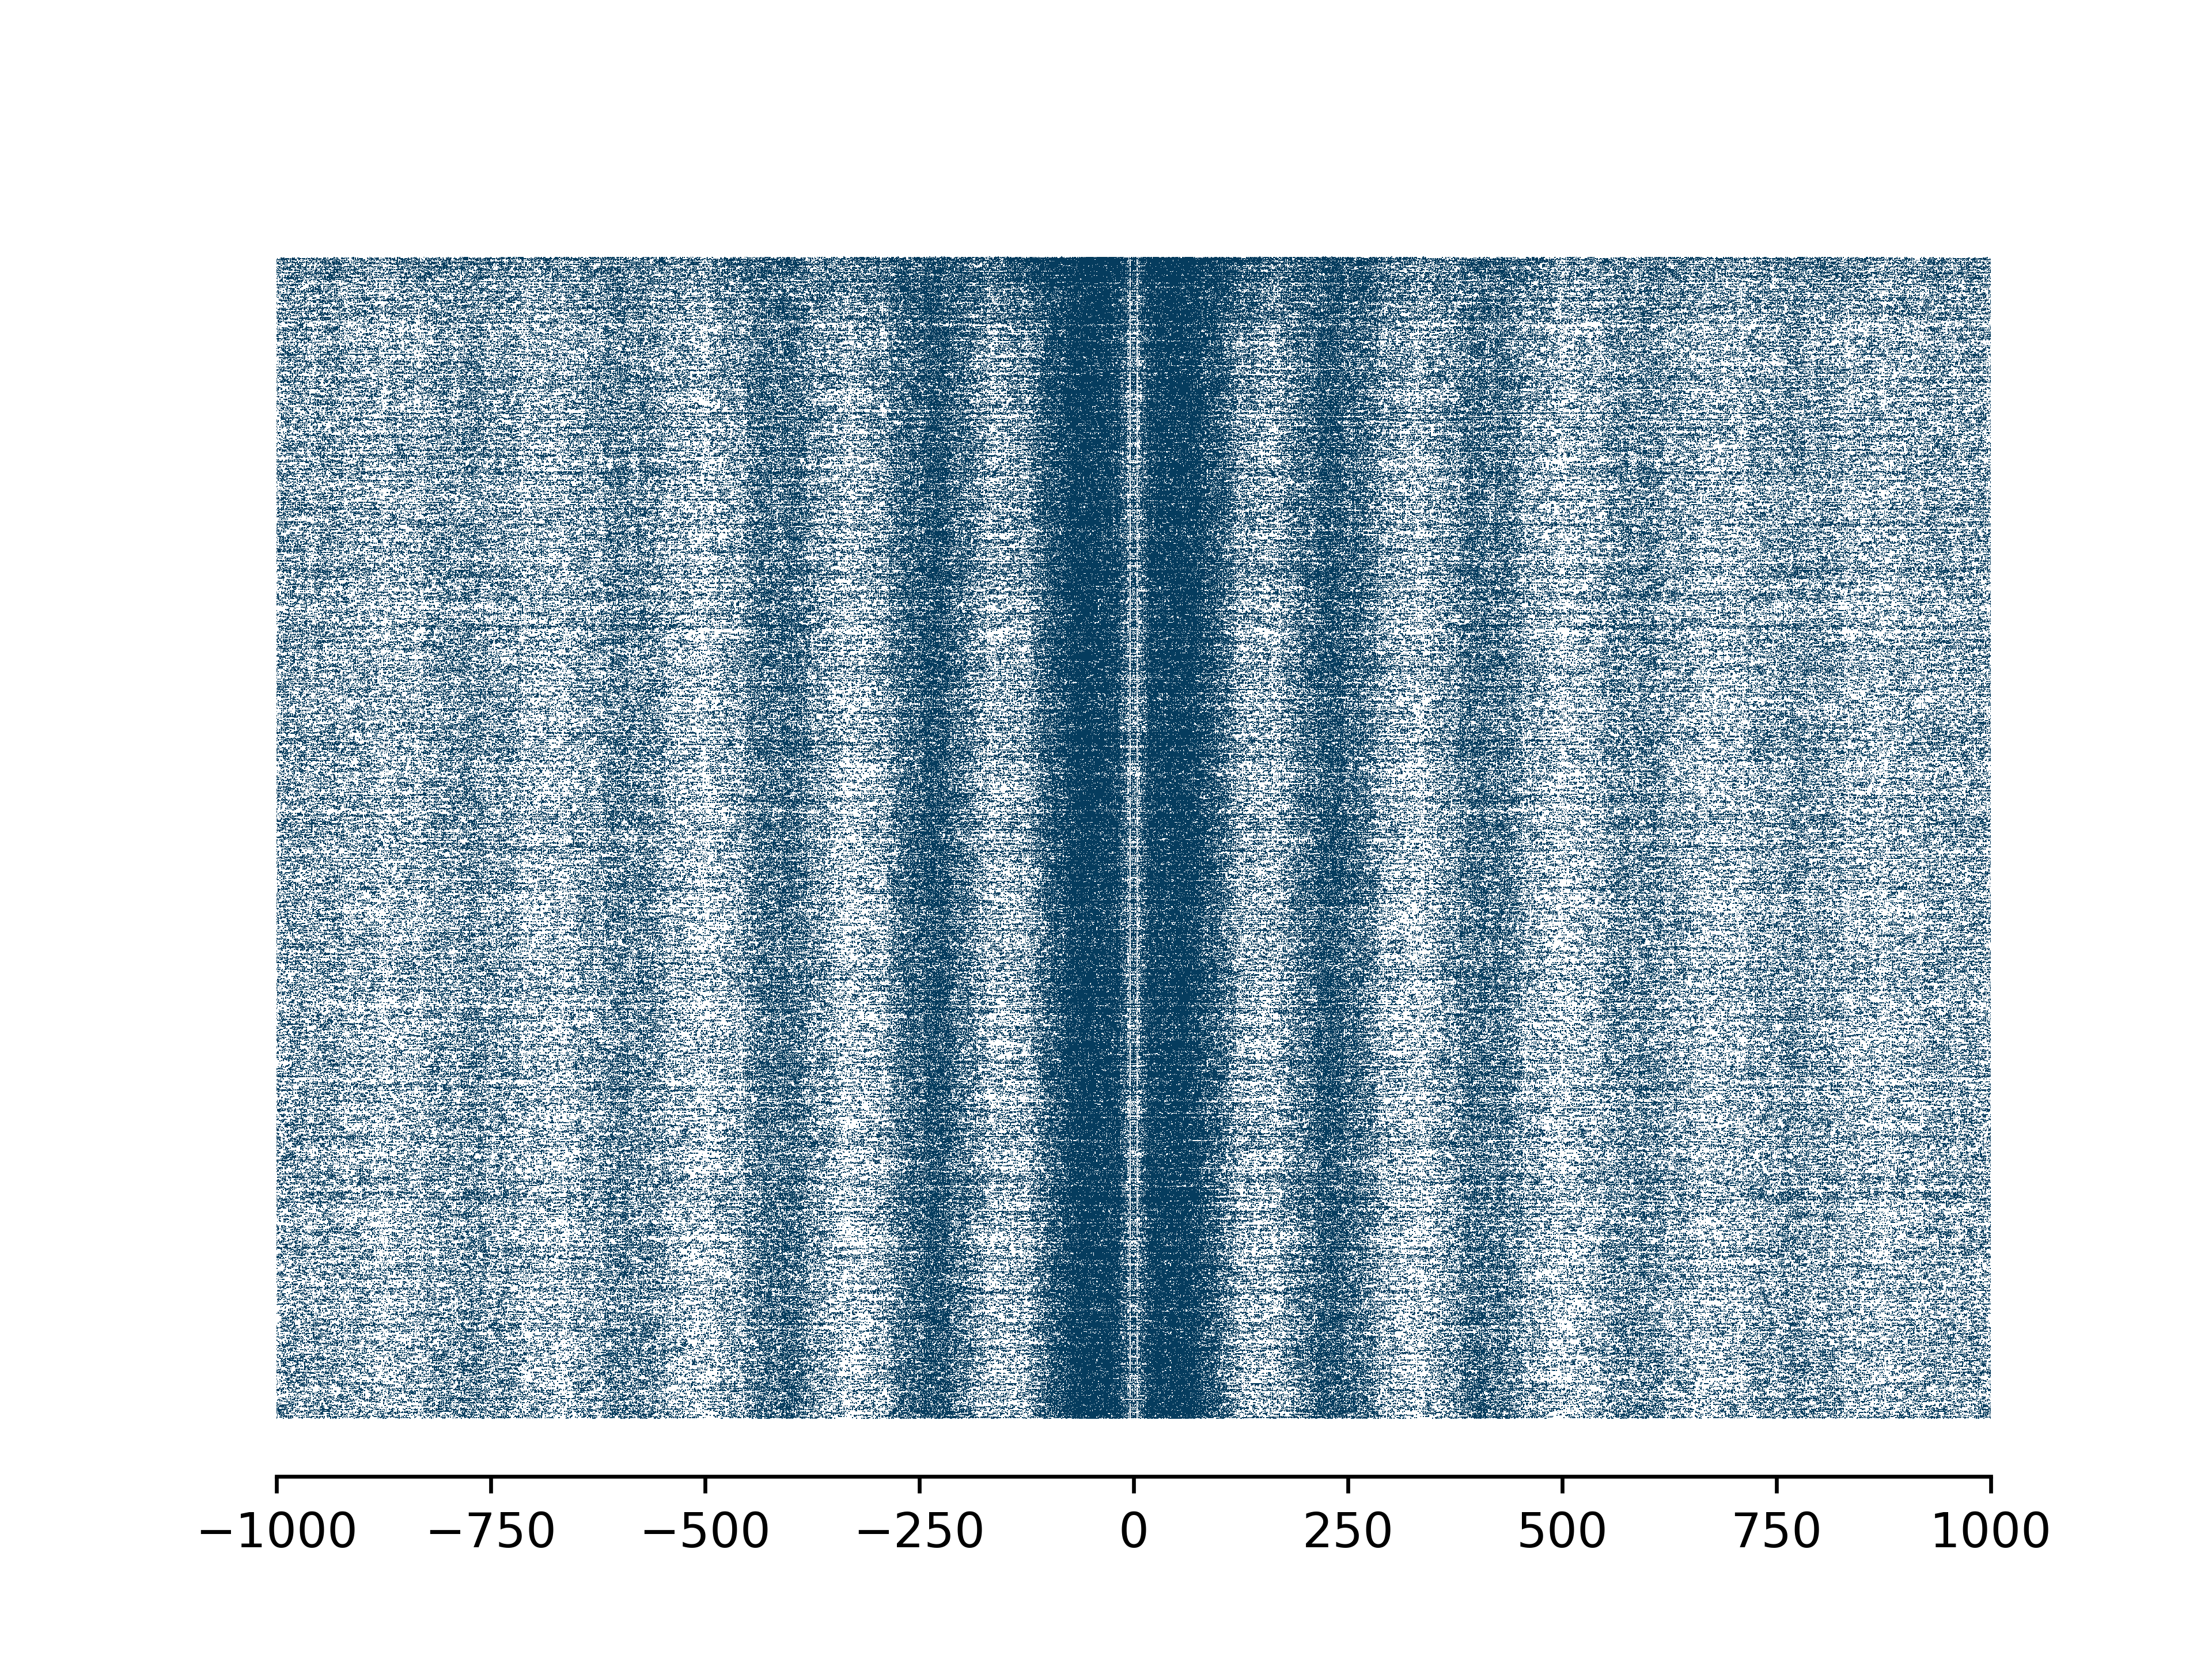
Plot single molecules centered at regions of interest defined in bed file and produce aggregate profile
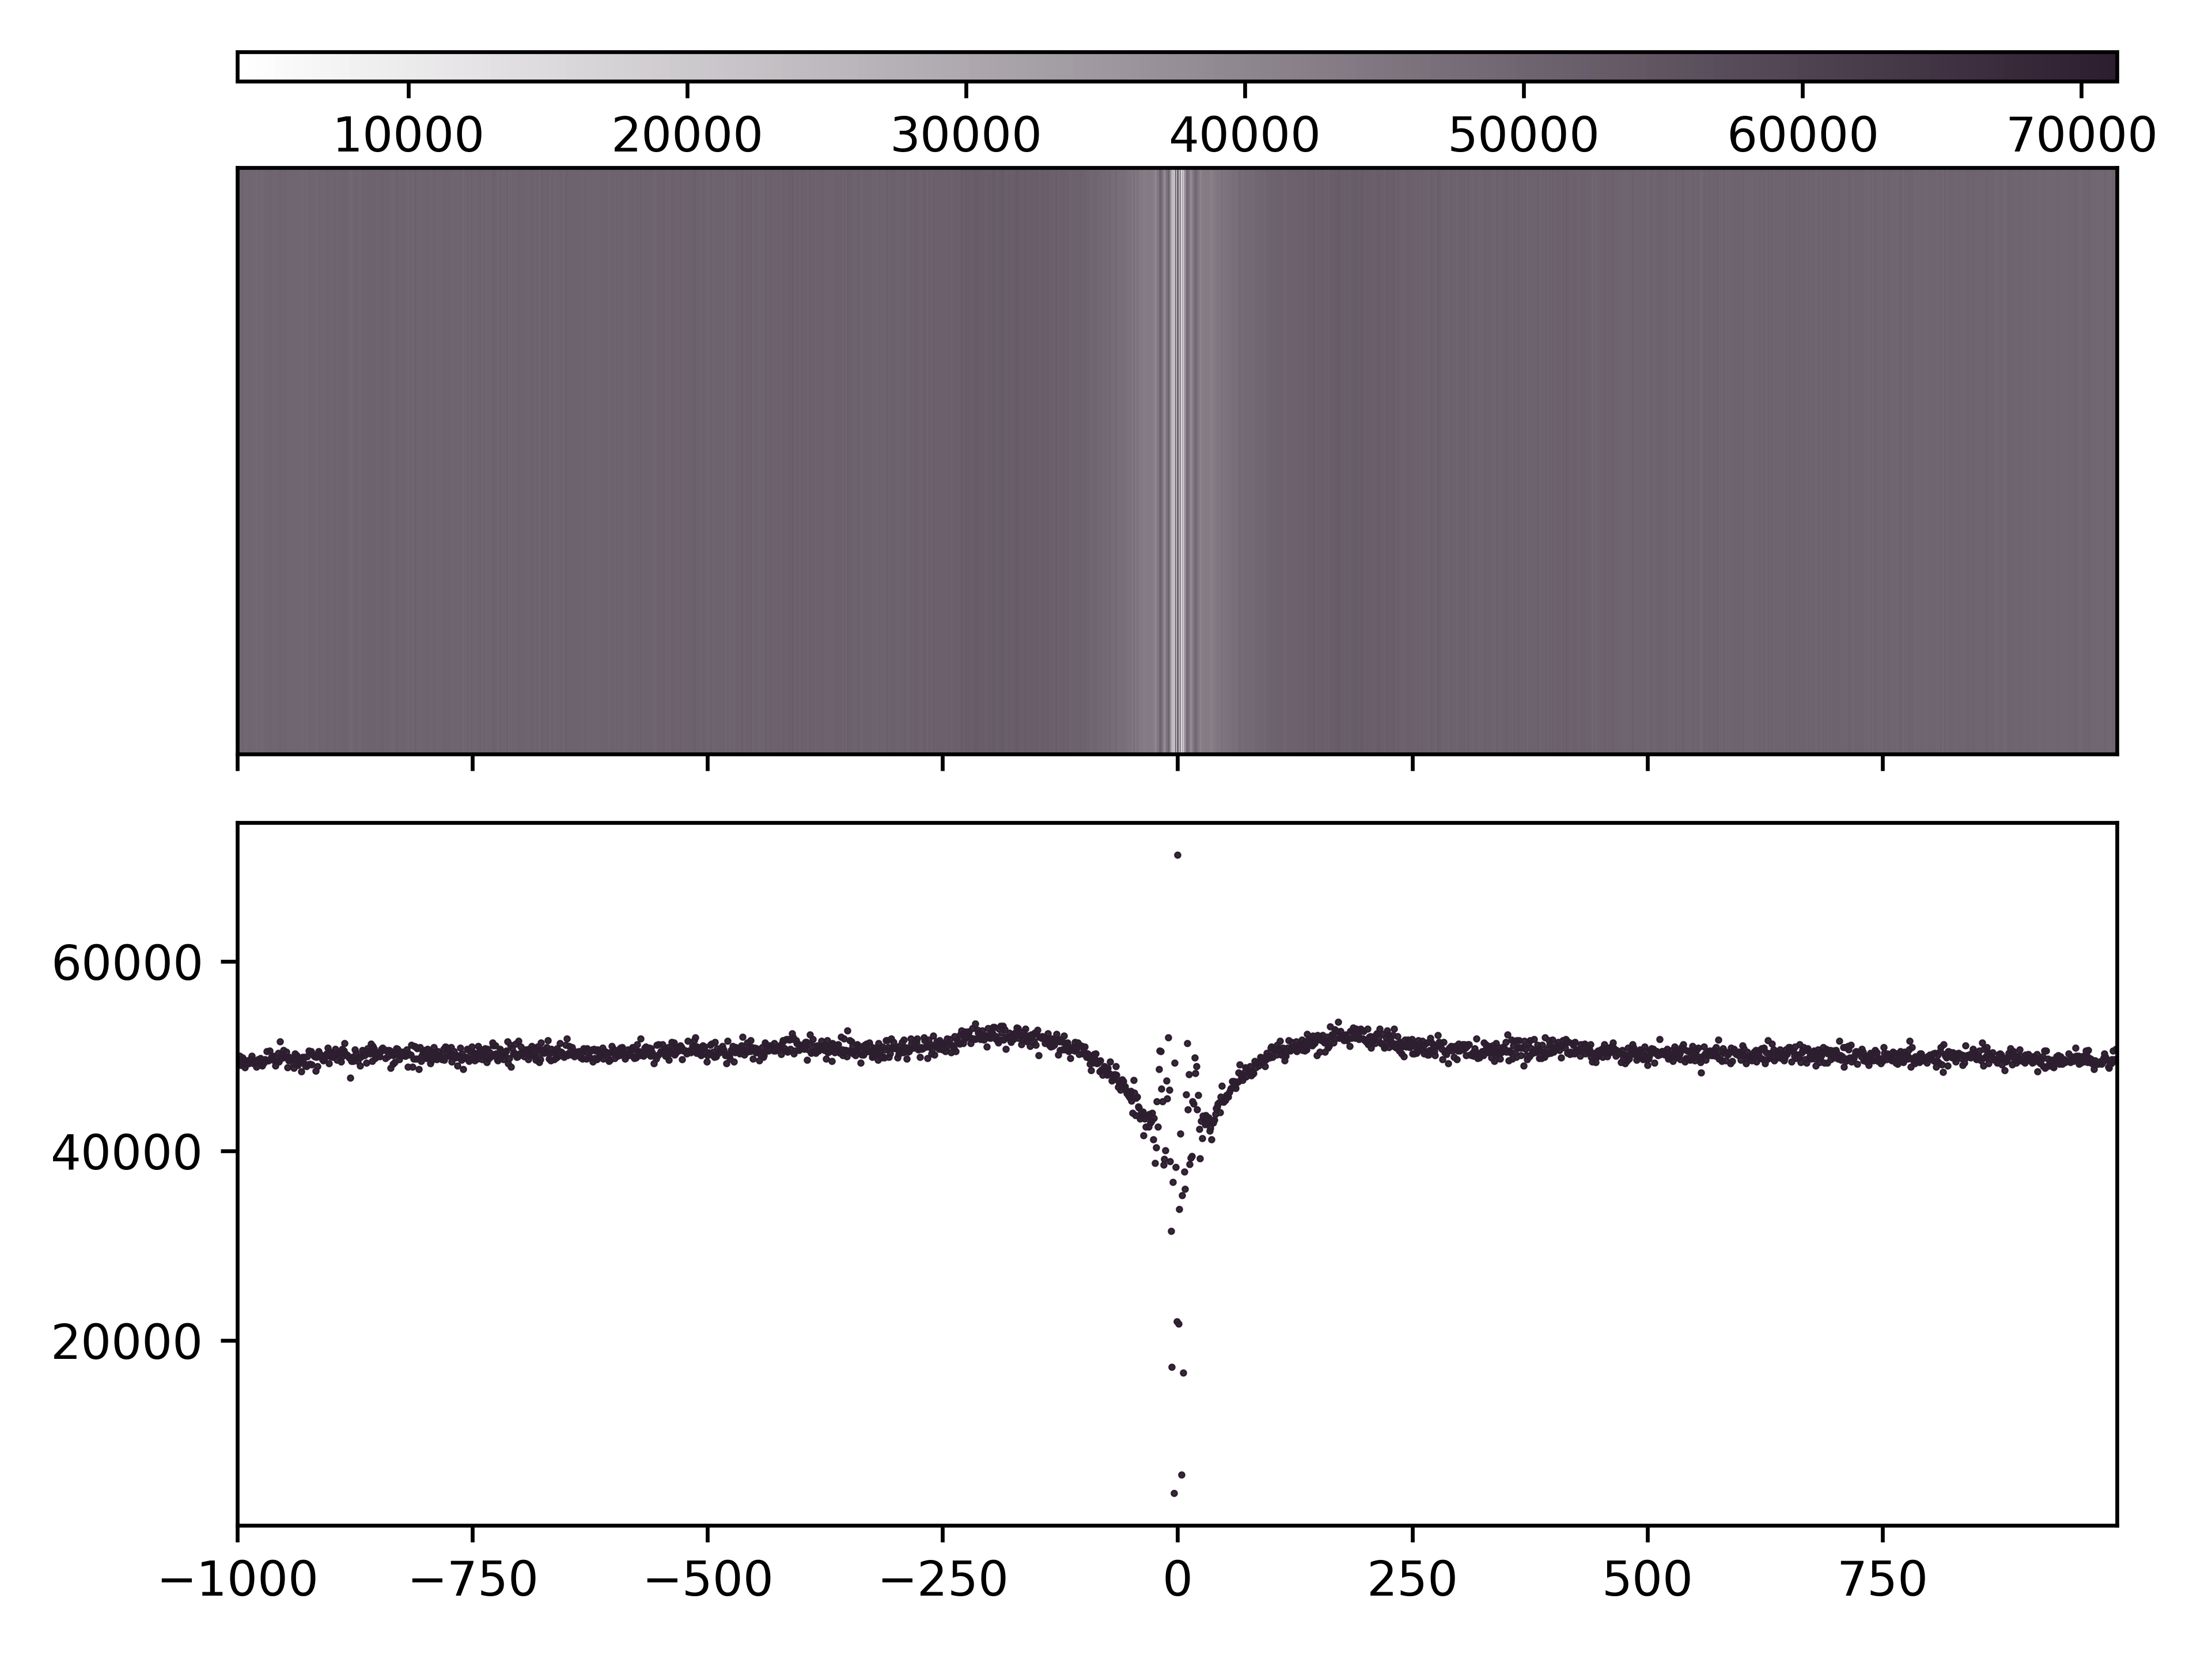
Create (1) aggregate profile plots for mA/A, (2) single-molecule plots for mA, and (3) base abundance plots for A.
1. Python option
import dimelo as dm

bam = "deep_ctcf_mod_mappings_merge.sorted.bam"
sampleName = "quartile4"
bed = "quart4.bed"
outDir = "./out"
dm.plot_enrichment_profile(
    bam, sampleName, bed, "A", outDir, threshA=190, dotsize=0.05
)
2. Command line option
dimelo-plot-enrichment-profile -f deep_ctcf_mod_mappings_merge.sorted.bam -s quartile4 -b quart4.bed -m A -o ./out -A 190 -d 0.05
Output


Total running time of the script: ( 0 minutes 0.000 seconds)