Note
Click here to download the full example code
Enrichment Plot Comparison Across BAMs
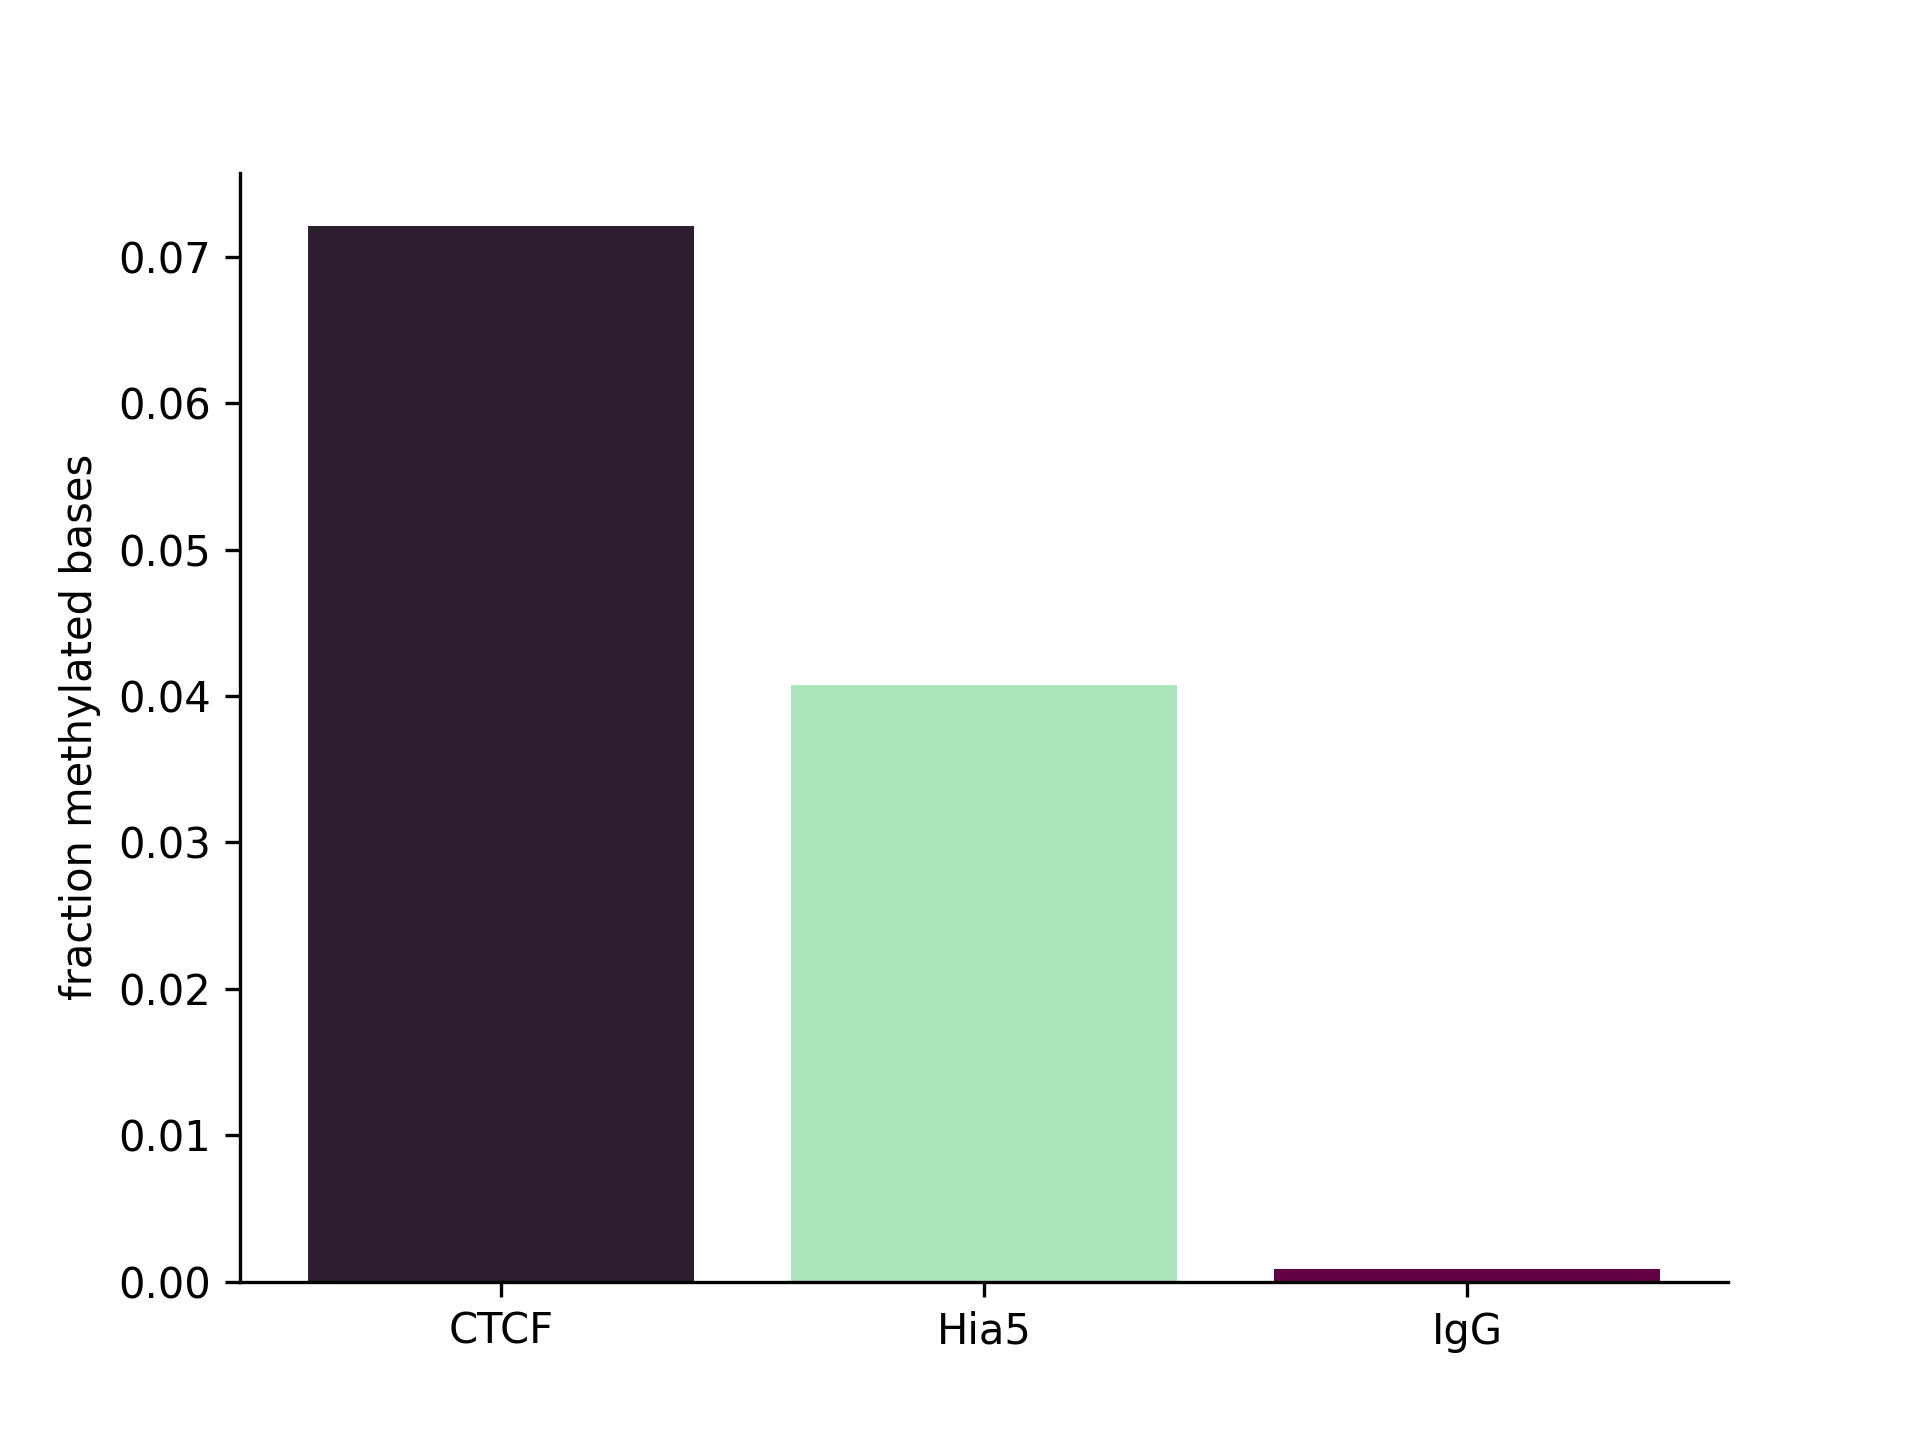
Plot overall fraction of methylated bases within regions of interest specified by bed file across multiple samples.
Create barplot comparing methylation levels in bed file regions of interest across samples
1. Python option
import dimelo as dm

bams = [
    "deep_ctcf_mod_mappings_merge.sorted.bam",
    "hia5_mod_mappings.bam",
    "igg_mod_mappings.bam",
]
sampleNames = ["CTCF", "Hia5", "IgG"]
bed = "q10.150.slop.bed"
outDir = "./out"
dm.plot_enrichment(bams, sampleNames, bed, "A", outDir, threshA=190)
2. Command line option
dimelo-plot-enrichment -f deep_ctcf_mod_mappings_merge.sorted.bam hia5_mod_mappings.bam igg_mod_mappings.bam -s CTCF Hia5 IgG -b q10.150.slop.bed -m A -o ./out -A 190
Output

Total running time of the script: ( 0 minutes 0.000 seconds)